Posts

Energy correlation between Pizza and Diesel

Image
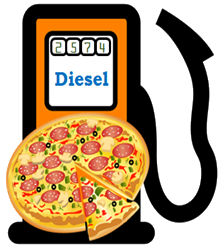
Assume a slice of pizza weighing 100 g has 250 Calories. Correlate its energy content to diesel (calorific value of diesel is 44000 kJ/kg; density of diesel is 0.83 kg L –1 ).   One dietary Calorie, C is equal to 1 kilocalories (kcal).   1 calorie = 4.184 Joules. 1 kg or 1000 g diesel has 44000 kJ = 44000/4.184 ≈ 10516 kcal.   In other words, 10516 kcal are present in 1000 g of diesel.   It is mentioned that, 100 g pizza = 250 kcal (or 250 C). Therefore, 250 kcal are present in (250×1000)/ 10516 = 23.8 g diesel.   Density of diesel = 0.83 kg L –1 = 830 g per 1000 mL.   This means, 830 g diesel occupies 1000 mL volume.    ∴ 23.8 g diesel = (23.8×1000)/830 ≈ 28.7 mL.   Hence, 100 g pizza with 250 Calories ≅ 28.7 mL of diesel.  

Simulating Cyclic voltammetric curves

Image
Cyclic voltammetry is an imperative electrochemical analytical tool to probe the electrochemical characteristics, electrochemical kinetics and to assess the performance of the fabricated electrode materials for batteries, supercapacitors, fuel cells, biosensors, etc. It is also deployed to scrutinize the electrochemical signature of the pharmaceutical / chemical / biochemical compounds and nanocomposite materials, polymers, complexes, etc., as well as to explore the electron transfer process from energy storage to bio-medical applications.   It consists of three electrode cell assembly immersed in the electrolyte and a computer controlled Potentiostat is used to control the potential and to monitor the current. 1. Working electrode (WE) where the required redox reaction takes place. 2. Reference electrode (RE) to vary / monitor the potential (E, V) of the WE. Potential between WE and RE is varied at a pre-defined scan-rate, denoted as ν (V.s -1 ) between t

XRD CUBIC - Simulation of Unit cell dimension, (h, k, l) - Miller indices d-spacing from X-ray diffraction (XRD) angle, 2-theta (For Cubic crystals)

Image
Designed a basic computer program “XRD CUBIC” (coded in Python)  to simulate possible unit crystal cell length (a), Miller indices - {h, k, l} and interplanar spacing (d) for cubic crystals from observed (experimental) X-ray diffraction (XRD) angle that is 2-theta.   It can simulate all these possible crystal lattice parameters for cubic crystal systems such as Simple Cubic or Face Centered Cubic or Body Centered Cubic systems, between the given 2–theta values within the range of specified cell length (a) limits.     1. Enter wavelength of X-ray (in Angstroms) 2. Enter minimum and maximum diffraction angle as 2-theta (in Degrees) 3. Enter minimum and maximum unit cell length (in Angstroms) All the possible cubic crystal parameters as well as diffraction angle with reference to d-spacing between the given Miller indices (h k l planes) will be simulated. Video Tutorial   Designed by: Dr. M Kanagasabapathy, Asst. Professor Departm

NSE live BANK NIFTY option chain data in Excel sheet

Image
Get the Live NIFTY Bank Index Option Chain Data in Excel Sheet for CE & PE. Bank Nifty Trend can analyzed from this Excel based on Change in Open Interest, Price and Volume. Fetch the various data such as Last Traded Price (LTP), Open Interest (OI), Change in Open Interest (%), Change in Price (%), Total Volume Traded, Buy Volume, Sell Volume, Implied Volatility (IV), etc., for both Calls and Puts. A simplified Excel sheet for traders of Bank Nifty Index, coded in VBA, to fetch the real-time NSE BANK NIFTY option chain price data with different expiry dates and at a few strike prices from the underlying price. Analyze in-depth for the changes in Open Interest (OI), Changes in Price as well as the Buy, Sell Volumes, Total Volumes Traded etc., at a few different strike prices with At the Money (ATM).  Screenshot Designed by, Dr. M Kanagasabapathy Important Disclaimer: This Excel Sheet is designed for educational purposes only.  Either this web page or the Administrator of this web p

Laptop Battery Life Saver

Image
Coded a lightweight program (600 KB), 'Battery Life Saver' to extend the life span of laptop batteries. Using a Laptop Battery continuously by overcharging above 90% or by below 15%, reduces its life span.   This light-weight .exe program, Battery Life Saver will alarm, on excess charging or discharging.   Set the desired Battery Limit Percentage using the slider, say 50% and allow the Battery Life Saver to give alarm. It automatically detects, charging and battery status. Screenshots DOWNLOAD Download the Python codes for this program, from this page.   Python code for Laptop Battery Life Saver     Author Dr. M Kanagasabapathy Asst. Professor, Department of Chemistry Rajus’ College, Madurai Kamaraj University Rajapalayam (Tamil Nadu) India 626117

Google Sheet to check the consistent growth of a stock for 52 weeks

Image
Designed a Google sheet-based analysis to check, whether the growth of a stock is consistent or not in the past one year. It calculates and averages the return of every previous, 7 days' close price for the past 1 year, from yesterday’s date and closing price. So it's possible to check whether the growth is consistent for the past 52 weeks instead of conventional one-year return calculation, which is based on initial and final dates of a year. In simple, it estimates an average of weekly returns (for the consequent previous 52 weeks from yesterday) and compares it with conventional yearly return (%). Screenshot Link to Google sheet

INVESTOCK – Simple Python computer programing code to fetch & back test NSE historical (15+ years) stock price data

Image
F et ch hist orical price data and back test between any two dates of NSE Stocks using this simple Python code and import them in .CSV file and predict the winning percentage. Step 1. Install NSEPY Open Command Prompt (in Windows 10) as Administrator. Then paste the following commands (shown in red ) one after another. C:\Python\python.exe -m pip install --upgrade pip Wait to upgrade... pip install nsepy Wait to upgrade... pip install nsepy –upgrade Wait to upgrade... Screenshot for installation in Windows 10 OS. Step 2. Fetching the price data Now open Python IDLE and paste the following code. Save it with a suitable filename, with an extension '.py'. Stock symbols and Date Enter the equity code as in NSE, India. Example: “TCS”) Enter starting and closing date digits, in the format, “yyyy,mm,dd” Example: “7-Aug-2021” is entered as: “2021,8,7") Change Symbol and starting as well as closing date in the required format. The data will be saved as .CSV file. Code Copy and past

How to calculate Area under Curve & FWHM using the computer program Origin?

Image
Area under a curve can be estimated by integration method. (Check the references for more details.) Full width at half maximum (FWHM) for a curve is used in many scientific data analyses.  For instance, in X–ray diffraction (XRD) analysis of crystal data, it is used to find grain size.   It can be easily calculated using, quadratic equation. (Check the references for more details.) This tutorial shows how to use the computer program Origin to estimate both ' Area under a Curve ' as well as ' FWHM '. Check these eNotes for  references 1.  Full Width at Half Maximum (FWHM) & Quadratic equation 2. Introduction to Quadratic equation 3.  Area under curve by integration method

JavaScript Codes: Math - Trigonometric Functions

Input : Sine JavaScript & HTML code for SINE function Input : Sine JavaScript - Trigonometric Functions Calculator Input:        (Values in degree) sin : cos : tan : csc : sec : cot : asin : acos : atan : sinh : cosh : tanh : csch : sech : coth : asinh: acosh: atanh:

VESTA for Linux Mint (Debian file)

Image
Linux Mint is one of the best operating system with a good GUI, open-sourced and can be installed on old PCs also. And VESTA is a computer package to analyze crystal structures & geometry, X-ray diffraction simulation (XRD), and to investigate Miller indices {h k l} data for crystal systems,  space groups of crystalline materials etc.  It is a 3D visualization program for structural models, volumetric data such as electron/nuclear densities, and crystal morphologies. it also deals with multiple structural models, volumetric data, and crystal morphologies in the same window. But its Debian version for Linux Mint operating system is not available for direct download.  You can download the VESTA.deb for Linux Mint from here.

Interpretation of open interest (OI) & price change of a stock

Image
Based on open interest & price change data of a stock, the price trend of the stock is correlated as: Price Open Interest Price trend Increase Increase Increase (More buyers & long build-up) Increase Decrease Increase (Short positions covering)  Decrease Increase Decrease (More short positions build-up)  Decrease Decrease Decrease ( Long unwinding Buyers become sellers)            

Python code to remove meta data from .mp3 files

Image
    How to remove meta data (ID tags) from .mp3 file with Python?   Meta data refers ID3 tags or extra information encoded into mp3 files such as title, artist s name, composer s details, release year, credits, rating and other information related to the album.   These meta data can be removed without altering the quality of the mp3 file, with this Python code.   Install mutagen via command prompt and run the code.   Directory of this program should be in the folder containing .mp3 files.   Most importantly, back-up your files before running this code.   Designed by, Dr. M Kanagasabapathy www.enote.page     Python code: import os import sys import codecs from mutagen.mp3 import MP3 TEXT_ENCODING = 'utf8'   if (len(sys.argv) > 1): fpath = sys.argv[1] else: fpath = os.path.abspath(os.path.dirname(sys.argv[0]))   for fn in os.listdir(fpath):   fname = os.path.join(fpath, fn) if

Butler–Volmer equation & Current density

At 298 K the exchange current density (i o ) of an electrode having a surface area of 5 cm 2 , used in an electrodeposition process is 0.79 mA cm –2 . Estimate the applied current through the electrode if the overpotential (η) is 5 mV.   Required formula derived from the Butler–Volmer equation is: i = (i o η F) / (R T) where, ‘i’ is the applied current density (mA cm –2 ) i o is exchange current density = 0.79 mA cm –2 η is overpotential = 5 mV F is Faraday = 96485 C mol –1 R is gas constant = 8.314 J K –1 mol –1 T is temperature (in K) = 298 K Current density = Current (mA) / Surface area (cm 2 ) Surface area = 5 cm 2   Substituting these values in the equation, value of the applied current density is: i = (0.79 mA cm –2 × 5 mV × 96485 C mol –1 ) / (8.314 J K –1 mol –1 × 298 K).   Since, Joule = Volt × Coulomb or J = V × C. So, i = (0.79 mA cm –2 × 5 mV × 96485 C mol –1 ) / (8.314 V C K –1 mol –1 × 298 K)   And, 1 V = 1000 mV

Conversion of electrical units (Capacitance) into energy and power units

Symbols used in this notes are: F – Farad; C – Coulomb; V – Volt; A – Ampere; J –Joules; s – second; W – Watt; g – gram; h – hour   Correlation between electrical (capacitance) and energy and power units F = C/V W = A×V C = A×s J = W×s (Energy unit) F =(A×s)/ V So, F×(V^2) = A×s×V = W×s = J Or, F = (W×s) / V^2 = J / V^2 Note : Faraday's Constant is different from Farad. (Not confused, though both represented by symbol 'F'.) 1 Faraday = 96485 C 1 Faraday = (96485 C /3600 s) = 26.801 A·h   Capacitance is expressed in, F Energy is expressed in, Wh Power is expressed in, W   Specific Capacitance is expressed as: F/kg (or) F/g Specific Energy is expressed as: Wh/kg (or) Wh/g Specific Power is expressed as: W/kg (or) W/g   Assume a supercapacitor has a Specific Capacitance of 2000 F/g and discharges at a potential difference of 1 V in 900 s, then Specific Energy and Specific Power is related to its Specific Capacitance a